How to Personalize Projects with GanttPRO: Custom Columns
February 20, 2019 / Estimated reading time: 4 minutes
Projects and teams are unique. Some of them have no chances for success from the very beginning as the overall success depends on a bunch of various factors. These factors should be taken into consideration as early as possible. Among all other aspects, an online project planning tool looks like one of the most critical.
As projects and teams, planning tools are also unique. Of course, they have features in common, as these features are integral parts of Project Management as a discipline. At the same time, tools are different. This difference can be achieved through advanced features, personalization of settings and views. Just think of it: how easier your work could be if you had a chance to enter and visualize your personal settings in the way you and your team wanted it. So, we are sure we can impress you!
This is our second release in 2019. Following the January one where we implemented Tasks list view and redesigned project settings, here comes the turn of the February 2019 release.
What’s in the release:
Track what you need with personal configuration. Fast and easy
Previously in GanttPRO, there was a possibility to work with the following predefined columns: Work breakdown structure, Start date, End date, Creation date, Creator, Duration, Progress, Estimation, Cost, Assigned, Status, and Priority. This is a good but rather limited choice. However, it is always great to have own columns, isn’t it? From now on, you can add anything you need with the help of new custom columns with personal values. And these values are not limited!
Need to work with personal budget or differentiate colors for tasks? Personal dates? Text? No worries as now you have this all and it all works for a variety of projects from different spheres: software development, construction, marketing, manufacturing, and many others.
Types of new columns
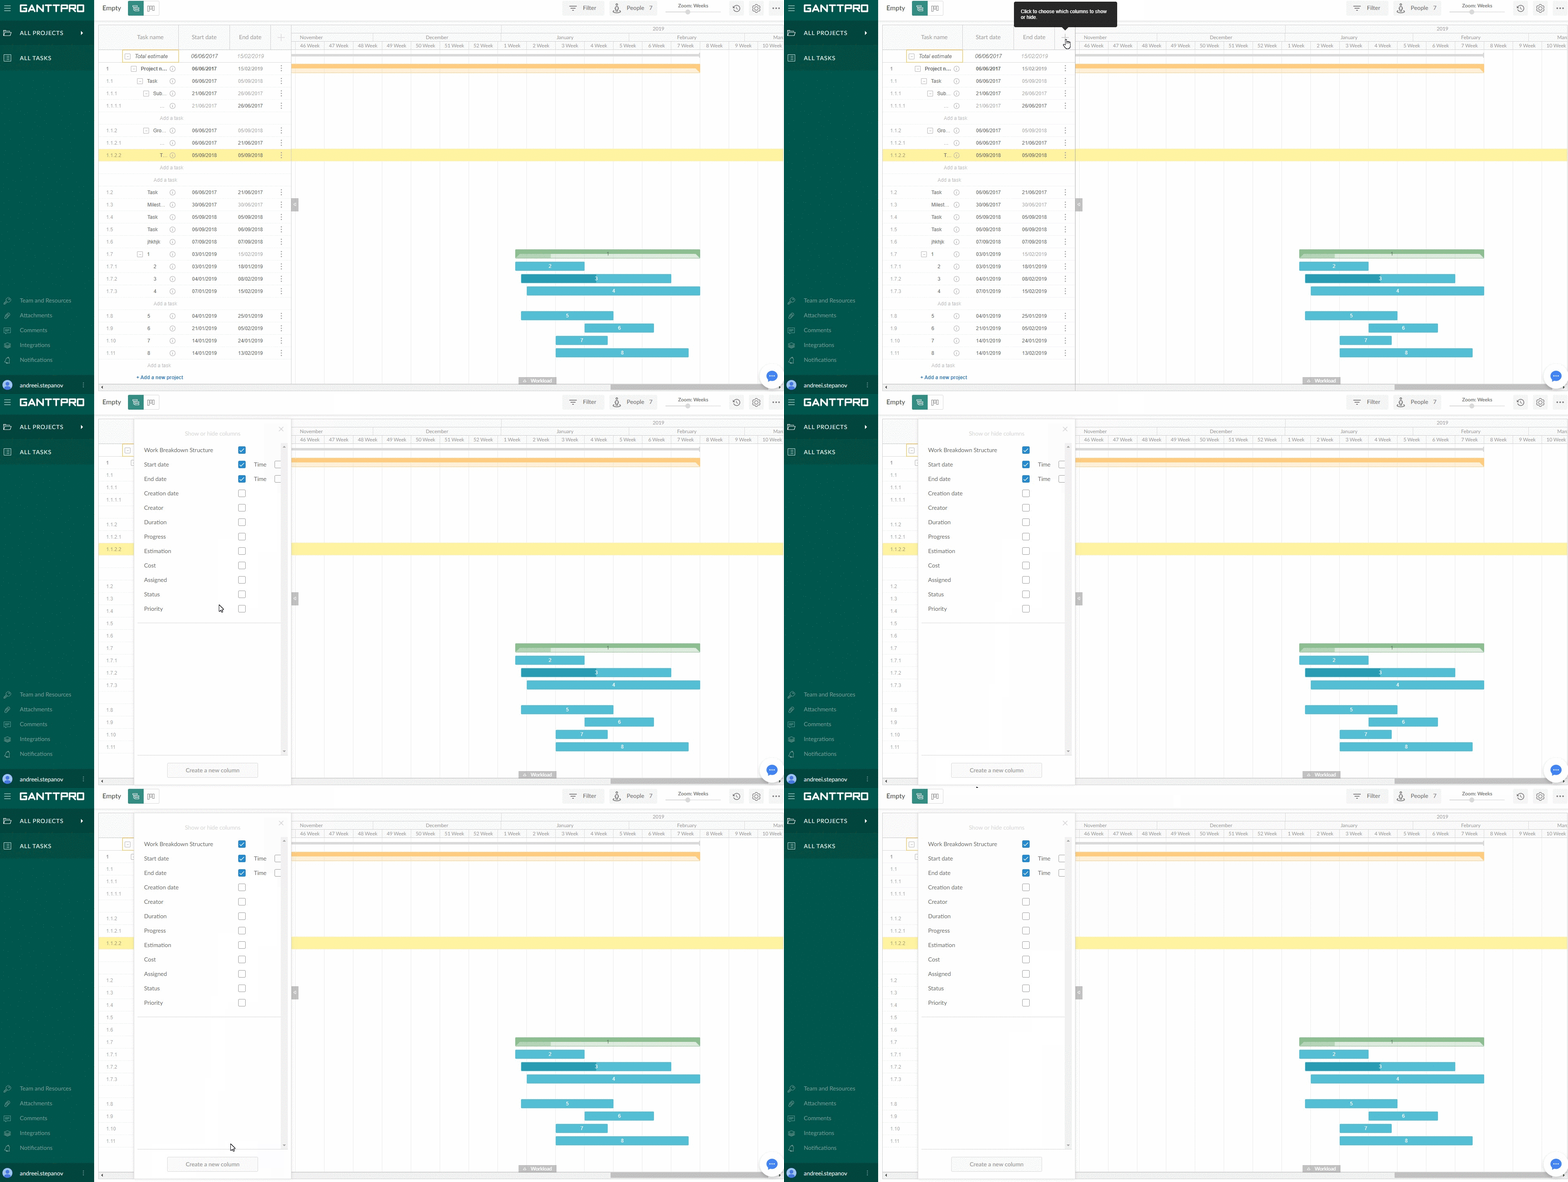
There are the following types of new columns: Text, Number, Date, List, Checkbox, Color. You will find the “Create a new column” button in the same window as in the case with the predefined columns: click on the + sign at the top right corner of the Gantt chart grid and go to the bottom.
Text
In the Text column, you can enter any text or digital information. It’s like your personal notes with quick access.
Number
In the Number column, you can enter any numbers you need for your project. For example, you need an extra way to follow your pricing or budget. When adding this column, you also need to choose Aggregation: Sum or Average. The first one is the sum of all the values. The second one is the division of the sum of the values by their number.
Note that sum or average values will be reflected for each parent task and the whole project.
Date
In the Date column, you can enter any date you need to have quick access to. It doesn’t affect tasks dates.
List
In the List column, you can create a dropdown with a list of fields. For this, an Owner or an Admin create the required fields, name them, and with a tick choose the one that will be shown in a project grid by default. Note that you can drag & drop fields at the moment of their creation.
Checkbox
In the Checkbox column, you can check the box to mark it as Yes or No according to the specified name in the grid.
Color
In the Color column, you can choose the color for any task in your project to differentiate them.
Note
- When you work with custom columns, every step you make is saved in the History of changes.
- Owners, Admins, and Members in case these members have the right to edit can rename any column at any moment but there is no possibility for anyone to change the type of a column.
Here is the video that will help you quickly understand how to work with custom columns in GanttPRO.
Redesigned baseline
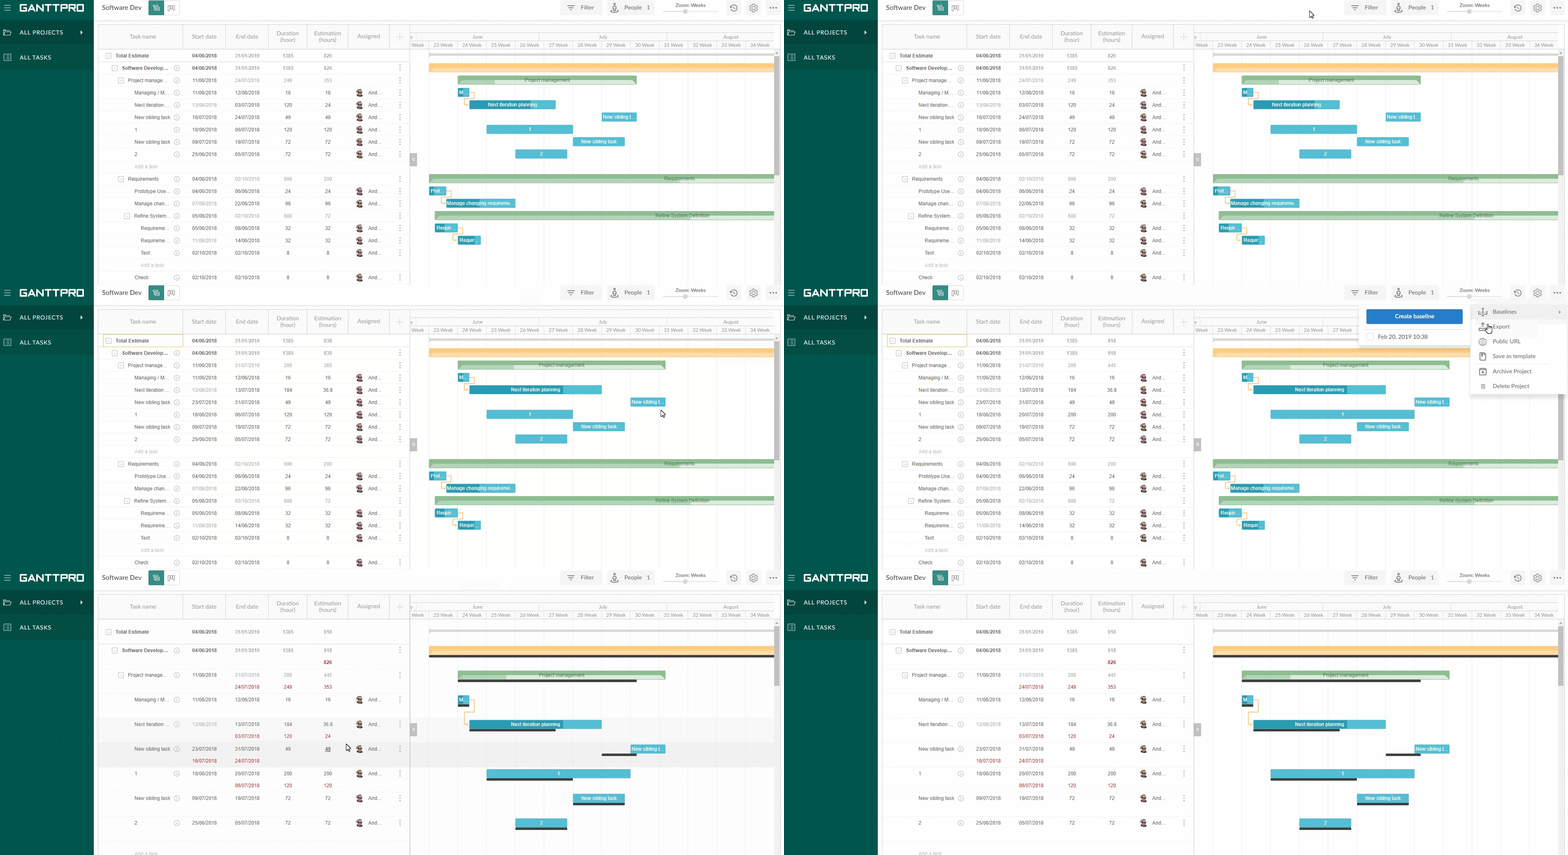
We redesigned the baseline feature to make it more visually appealing so you can immediately see any deviations in your plan.
The changes are shown both in the grid and in the Gantt chart.
Grid
In the grid, the values for the baseline are shown in the red color. Deviations are shown in the regular colors.
Gantt chart
The bars for the baseline are shown in the black color. Deviations are shown in the regular colors.
Summary
The introduced features work well for all managers and teams. Have you not tried GanttPRO yet? Start a free 14-day trial to test it and check new features
Any question left? Ask in the Live Chat, email at [email protected] or book a GanttPRO demo.
Are the introduced features helpful for you? We will be happy to hear your feedback in the comments below.
Great features! Thank you guys 🙂 Your team is great